

Get your customer success strategy on the right track with these 11 essential metrics – check how to set up your customer success tracking and make the most of it.
Table of contents
Modern consumers have a plethora of different options for most goods and services these days. As such, brands have to put a lot of effort into succeeding and ensuring that the business model is running smoothly.
Even small mistakes can lead to unsatisfied customers who will then seek alternatives in your competition.
Of course, customer retention is just one side of the coin. Brands also have to work on attracting new customers without forgetting about existing customers. It is hard to imagine longevity depending on existing customers. At the same time, losing customer loyalty is detrimental to overall success as well.
Things are complicated, and business owners (i.e. beneficial owners under the Corporate Transparency Act) have to make difficult decisions. Instead of guessing blindly, justifying your choices through numbers is a much smarter approach.
You need to come up with strategies to boost customer success. These strategies require certain numbers and other metrics in measuring customer success and project future endeavors.
Let’s take a look at 11 key performance indicators (also known as customer success KPIs) that should be tracked regularly by brands that wish to attract new customers, retain current audiences, and gain an edge over the competition in their respective markets. Knowing about the best customer success metrics should help take your business to new heights.
#1 Net Promoter Score
The Net Promoter Score (NPS) is the first customer success metric on the list. Many businesses use this particular indicator. One of the reasons behind the popularity can be explained by the fact that measuring the NPS is relatively easy and straightforward for checking customer satisfaction.
You need to create a survey and ask an existing customer one question—how likely are they to recommend your product to someone else?
The survey should have a scale from 0 to 10. Zero being the lowest evaluation, and ten being the highest.
While collecting the data from the survey, separate the 0 to 10 scale into three parts:
- Scores of 0 to 6 are unhappy customers who are unlikely to recommend your product to someone else.
- Scores 7 to 8 are passives, which means that while their overall experience with the product is satisfactory, they are still unlikely to recommend it.
- Scores 9 to 10 are your promoters and fans who are happy with the products and would happily recommend them to others.
The Net Promoter Score can range from -100 to +100. To calculate NPS, detract the percentage of unhappy customers from the percentage of your promoters, ignoring passives.
For instance, if 70 percent of your customers are happy, 20 percent are passive, and 10 percent are unhappy, the formula is 70 - 10 = 60.
Naturally, the more responses from a survey you get, the more accurate your NPS will be. Also, if you are uncertain whether your score is good or not, look for a benchmark in your industry and measure it against the average to determine whether you are making customers happy.
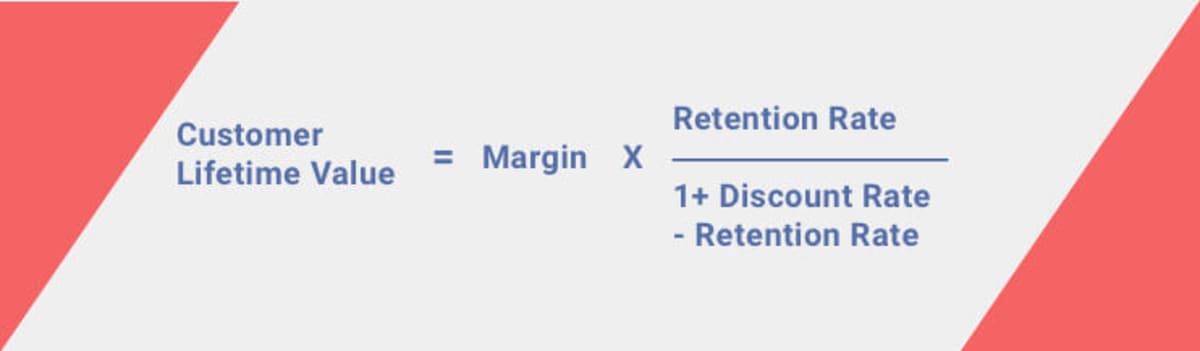
#2 Customer Lifetime Value
As far as important customer success metrics go, predicting how long a customer will be loyal to your business is more or less impossible. As is predicting how much money in total they will spend to purchase goods and products from you.
Nevertheless, the effort is still worth it because you can gather valuable data and create projections for your company’s future if you calculate customer lifetime. And average customer lifespan.
Arguably, long-term customer success efforts are built around CLV. To calculate the average customer lifetime and its value, check the graphic below:
#3 Customer Retention Cost
Retaining customers is tricky. Even if you convert a lead, you should not expect that your new customer will return for a second or third time.
Return on investment (ROI) is usually calculated by including customer retention costs because businesses invest a lot to improve customer retention. In other words, you want to include customer retention cost in the list of the key customer success metrics you need to track.
As far as calculating CRC goes, there is no universal formula that works. Given the intricacies and how each case is different, it is up to the business to find the tailor-made formula for its brand.
Here is how to calculate the customer retention costs:
- Average CRC per customer = Total CRC of all customers / Number of active customers in that period
- Average lifetime CRC per customer = Average CRC per customer X average customer lifetime
#4 Customer Satisfaction Score
The overall customer satisfaction score is another key indicator. Discovering how happy the clients are is a great way to learn how well your business is doing in the customer success aspect.
Note that this metric measures not just how the customers feel about your goods or services but the entire process, from onboarding and the work of your customer support team to completing the transaction and then using the product.
Similar to NPS, you need a survey to measure customer satisfaction score. Ask the respondents how satisfied they are with the brand. There should be five answers on the scale together with a number assigned to each:
- 1 for very dissatisfied
- 2 for dissatisfied
- 3 for neutral
- 4 for satisfied
- 5 for very satisfied
To measure customer satisfaction rating, divide all the satisfied responses by the total responses and multiply it by 100.
If you receive 1000 responses and 600 of them are positive, the formula looks like this:
600 (÷) 1000 x 100 = 60.
Again, the number might not mean that much by itself. You have to check the benchmark in your industry to see where your brand stands to figure out whether you need to improve customer satisfaction a lot or whether it is in a good place.
💡 To get a bigger picture of customer satisfaction, it is a good idea to collect qualitative customer feedback.
No clue how to increase a customer success metric? Maybe you should start by checking on your customer service. It’s key when it comes to a high customer satisfaction score. Implementing a chatbot solution may take only minutes and bring support service to the next level.
Not convinced? Check out 9 reasons why you need customer service chat.
#5 Renewal Rate
Renewal rate does not apply to every product, but if we are talking about computer software, digital magazine subscriptions, workout routines, etc. The renewal rate is one of the right customer success metrics that one should not underestimate.
Before calculating this indicator, a brand needs to determine two things—time period and category.
If customers have the option to renew the goods or services every day, week, month, or year, feel free to pick either of the available timeframes.
As for categories, the two that stand out the most are the total revenue and how many paying customers are renewing.
Check how many customers (subscribers) are up for renewal and how many customers already resubscribed. The rate can be measured by dividing the number of renewed subscriptions by the number of customers who are up for renewal and multiplying it by 100.
If you have 2000 customers up for renewal and 500 of them have already resubscribed, the formula looks like this:
500 (÷) 2000 x 100 = 40.
You should have access to the data that indicates renewals for specific periods, which means the option to research when your customers are most and least likely to subscribe and whether pushing them via reminders and other promotional methods improve the renewal rate.
#6 Daily Product Usage
Daily product usage is not a metric for every business. Just like the renewal rate, it is mostly available for digital services, given the nature of the indicator.
One of the best examples of this is streaming services. The likes of Netflix and Amazon have the necessary tools and analytics to keep track of how much time each account spends watching the content on the platform.
A similar thing can be said about video games. Video game developers usually sell digital game copies on platforms like Steam. Steam tracks how much each player has played a specific game and this data is then utilized by the game companies.
The tricky thing about the daily product usage metric is that it can be misleading. For instance, someone might have a TV show or a movie running in the background and not actually watching it.
Or, if you take the video game example, running a video game in the background while being away from the computer also does not reflect the actual engagement from a consumer on your analytics page.
Having said that, the metric is still valuable when you collect enough information from different customers.
#7 Customer Churn Rate
The customer churn rate, also known as customer attrition, is a metric that indicates how many consumers have stopped engaging with the brand. Canceled subscriptions, inactive accounts, no more renewals, and whatever else that can be treated as an indication that a customer is no longer active, affecting the churn rate.
Measuring customer engagement and the customer churn rate is pretty simple.
You take the number of customers at the beginning of a specific timeframe, such as a month or a year, and detract the number of customers who are still there at the end of the same period. Finally, divide the result by how many users were at the beginning.
Here is an example of how to calculate churn rate. Let’s say that at the beginning of the month, you had 500 monthly active users, and 350 customers were left by the end of the month. The formula to calculate the churn rate would look like this:
500 - 350 (÷) 500 = 0.3.
30 percent of your total customers disappeared. The metric is valuable because it functions as a warning about losses.
As soon as the rate becomes too high, brands need to take the necessary measures to identify the potential reasons behind a high churn rate and figure out how to prevent customer and revenue churn rate.
💡 Similar to other metrics, if you are not sure whether your churn rate is high or not, look at the benchmarks of your industry’s average churn rate and make conclusions then.
#8 Customer Acquisition Cost
It takes resources to acquire customers. And mismanaging the money and manpower can snowball out of control and result in poor RoI.
Brands that can spend a lot of money on marketing and new customer acquisition have the advantage because they do not have to worry about losses as much. Instead, they treat the resources spent as a future investment.
Smaller companies, meanwhile, have to manage their resources more carefully and not be as liberal as huge brands.
Keeping a close eye on customer acquisition costs shows whether you are doing things right or not.
For example, spending 1000 dollars on influencer marketing might net you 50 new customers, while spending the same sum on PPC marketing might get only 20 customers.
In the former example, you would spend 20 dollars on a new customer on average, whereas PPC marketing would be 50 dollars per new customer. As you can see, the former method is much customer acquisition cost-wise. The other way of saving some money is to automate customer acquisition activities. A chatbot is a helpful tool for it as well.
#9 Average Time Spent on a Platform
In a way, Google Analytics is used to measure customer success metrics, which also includes the average time spent on a website.
The metric is tracked to understand how long people spend on the website on average. Most visits do not result in a conversion. In fact, 2-3 percent is an average conversion rate. Anything above that is considered an excellent number.
Even if a site visitor does not convert, it can still provide useful information, such as:
- Individual website pages that are performing the best
- How mobile and desktop users engage with the website’s content
- Do visitors click on internal or external links
A poor average time spent on a platform warns you about potential shortfalls of the website that you need to rectify. Meanwhile, if a specific page has a great average time spent on a platform, you can copy some of its aspects on other pages to increase the average time site visitors spend on your website.
#10 Repeat Purchase Rate
Clients who shop more than once in your store are an excellent indicator of how you are doing. Repeated purchases supplement the customer retention rate, which is another crucial element to track customer success.
Calculations for the repeat purchase rate are not hard. You take the number of customers who shopped in your store more than once, divide it by the total number of customers, and multiply the result by 100 to get a percentage.
If you have 1000 total customers and 100 of them return, the formula looks like this:
100 (÷) 1000 x 100 = 10.
#11 Free Trial Conversion Rate
To get potential leads hooked, digital goods providers often offer free trials. The catch is pretty simple—you get people a taste of what they can get in a free trial, and if they find that the product fits their needs, that increases the odds of a conversion.
Free trials function as safety nets. Consumers do not have to risk spending money on a product that might backfire.
Three different trial models are available:
- A trial that requires credit card details from a customer
- A trial that does not require credit card details from a customer
- Freemium, which offers a free product but has customers pay for extra features
If you want to calculate the free trial conversion rate, divide the number of conversions from the free trial by the total number of users who participated in a trial and multiply it by 100.
Let’s say that the total number of trial participants was 500, and 150 paid for the product after the trial. The formula looks like this:
150 (÷) 500 x 100 = 30.
The importance of this customer success metric is pretty simple. If free trials are not resulting in new customer acquisition, then it means that you are doing something wrong.
These are only a handful of saas customer success metrics - all crucial for your business. If you’re interested, we’ve listed some more:
- first contact resolution rate
- customer retention rate
- customer effort score
- customer health score
- average purchase value
- average revenue per user
The list does not end here - there are plenty of them.
How to Boost Your Customer Success Metrics?
Now that you know about fundamental customer success metrics, it is up to you how you can work on the customer success efforts and boost them. Different methods work for different brands, but there are general pointers on how to improve the metric rates.
01 Transparent Policies
Brands need to enforce transparent policies. No hidden conditions for customers who sign up and have to pay extra fees for hidden features is a good example. Playing dirty is only going to backfire in the long run. Even if you manage to fool a few people with your proclamations, the truth gets out sooner rather than later.
02 Constant Feedback
Communicate internally and with your customers to receive as much customer feedback about your products and overall operations, such as new customer onboarding or logistics. How? Consider using a live chat.
Also, focus on identifying pain points and dedicate resources to fix them so that your customers are satisfied and happy enough to return and recommend the brand to friends and family.
You should have a dedicated customer support team with customer success managers who are in charge of working with both existing customers and new customers.
03 Website Improvements
The website’s uptime, loading speed, mobile device responsiveness, user interface, content quality, product reviews, and other elements determine conversion rates.
If you must, hire a website developer to revamp your platform according to a log analysis. And even if drastic changes are not necessary, you might still get suggestions on how to improve the site, which will result in better scores for customer success metrics.
04 Trial and Error
Businesses tend to stick to methods that they are familiar with and comfortable with, especially if these methods bring positive results. Nevertheless, this does not mean that one should forego opportunities to try something new.
Going all in for a potential customer marketing strategy is obviously risky, but trial and error is known to break the ice when a business stagnates.
From hiring employees who bring fresh ideas and become your customer success team to different takes on current goods or services, brands should have multiple channels where they can try new things and see how ideas affect your customer success program – and use customer training software to improve user experience.
05 Chatbot and/or Live Chat Implementation
A great way to improve SaaS customer metrics and grow your business is by using a chatbot and a live chat. They can answer customers’ questions in real-time, 24/7, without the need for human intervention. It’s effective and affordable. Additionally, a live chat can provide you with qualitative customer feedback.
Improve Customer Success Metrics with Smartsupp
SaaS companies, ecommerce businesses, and any other company might build an effective customer success strategy in no time with Smartsupp. With chatbot and live chat support, you can boost all the critical metrics and provide professional services. What’s more, it may increase the average revenue of your company.
No time to waste. Sign up for a free trial to boost customer success metrics and customer satisfaction!